Spurious (Spatial) Correlations
"Science"

We all know you can lie with graphs, but how well can you lie with spatial data?
In grad school, I took a course called Spatial Analysis. In it, I learned how to analyze geospatial data and look for trends. For our term project, we were each to take a spatial dataset relevant to our fields and apply our skills. I recalled Tyler Vigen’s Spurious Correlations, a website that draws correlations between (hopefully) unrelated data sets such as the divorce rate in Maine and margarine sales per capita. There is a wealth of freely available spatial data made available by government agencies and ESRI, so I thought it would be funny to try out similar techniques with these data sets for the state of Maine.
These are my results.
Eagles and K-Cups
With the exception of Washington County, eagles seem to make their homes in areas where household K-Cup ownership is at or higher than the national average.
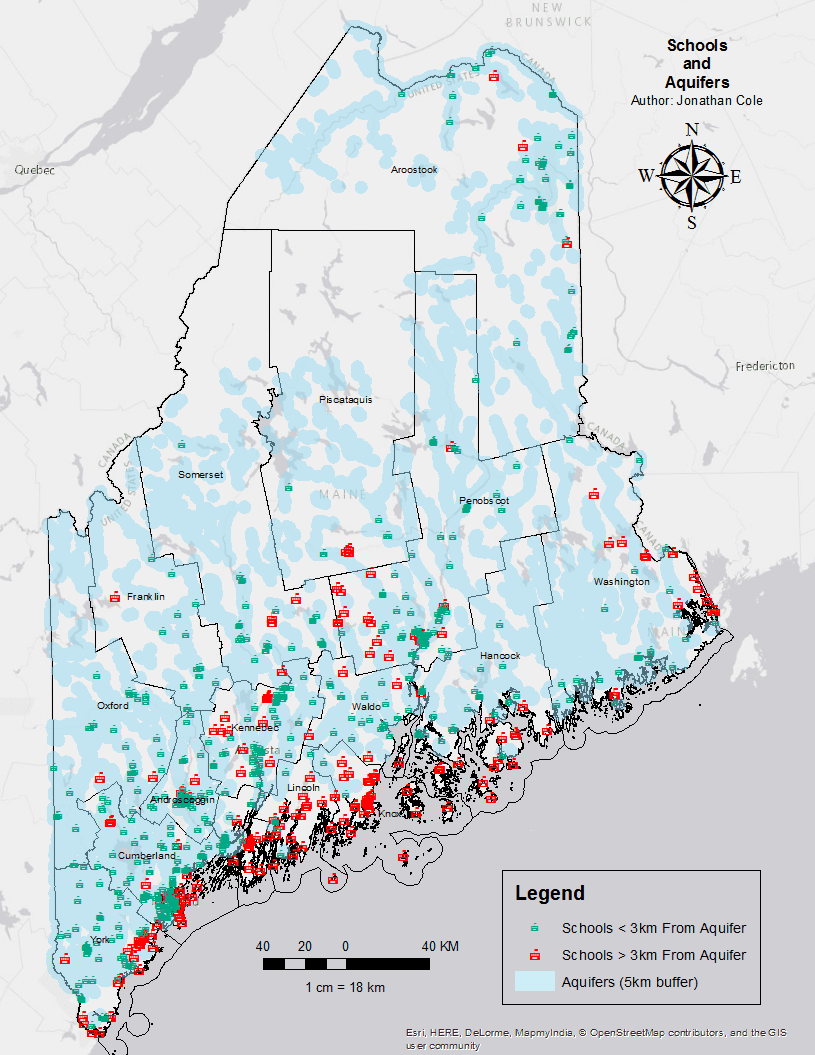
Schools and Aquifers
589 of Maine’s 795 schools are within 3 km of an aquifer. This means that if you are at a school, there is a 74% chance that you are within walking distance of a significant source of groundwater.
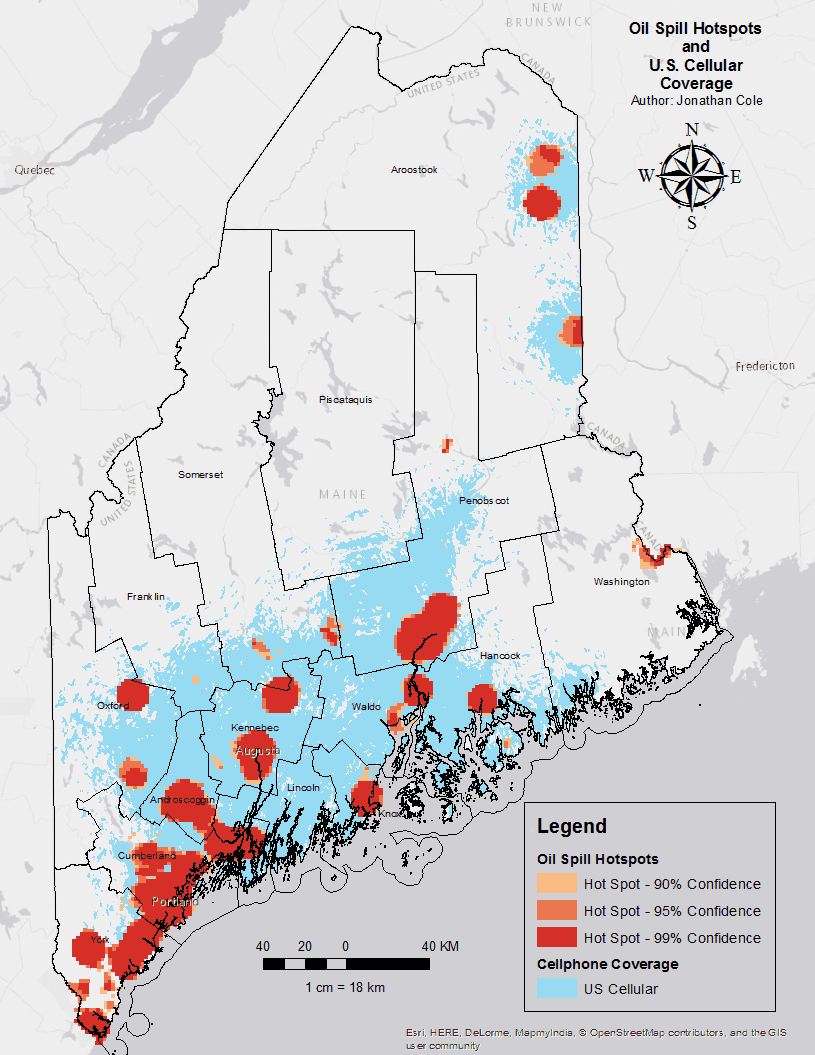
U.S. Cellular Coverage and Oil Spill Hotspots
US Cellular offers great coverage in areas where hazardous oil spills occur the most.
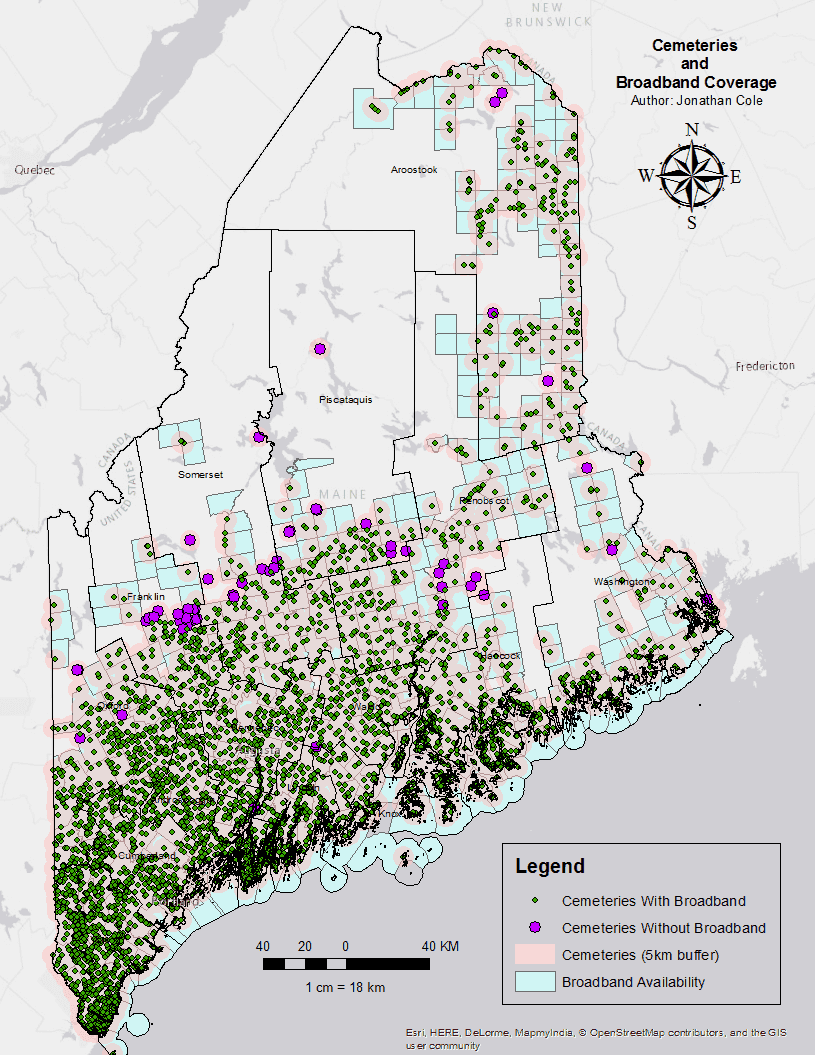
Cemeteries and Broadband Coverage
3875 of Maine’s 3929 cemeteries are located exactly within broadband coverage areas (98.63%).
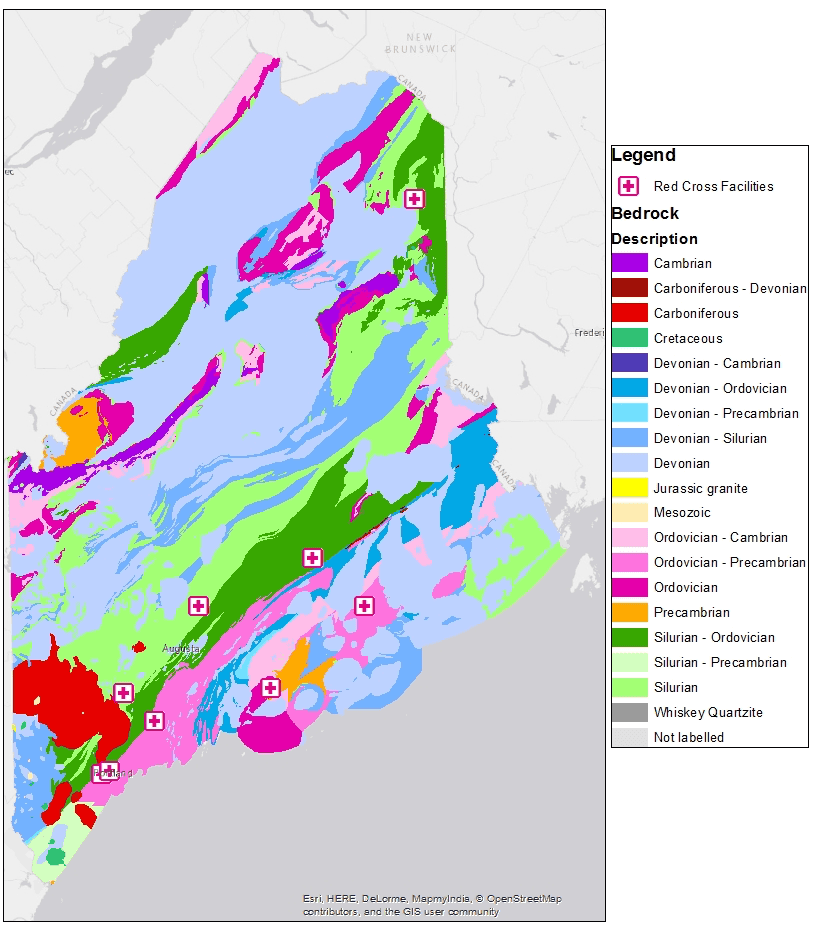
Red Cross Facilities and Bedrock Formation Eras
In what I can only consider to be a deliberate move, Red Cross has built their facilities in Maine on top of bedrock formed before the Devonian era. This means that if you got into a time machine and went back to the period at which the bedrock was formed beneath any Red Cross facility, you would not find sharks, ferns, trees, insects, or land vertebrates.
Disclaimer:
These datasets are in no way scientifically rigorous.


